
CppDepend Beta Detailed Eval Notes 6/6/09 - 6/16/09
I'm happy to report that my laptop is back up on the home network. Here are the notes from my first eval on the 6th and 7th, along with some pictures I blocked out on the 16th.
I downloaded and installed the CppDepend beta on June 6th. I had to install WinRAR eval to do so, as the Beta is distributed as a RAR file. I extracted the files the to C:\Program Files\CppDepend directory I had created for the Alpha test; I backed up and cleaned out the Alpha files first. Visual CppDepend worked the first time I tried it, using the icon I had already set up on my desktop for the Alpha test.
I tried to analyze the GSITK project first. It worked! I was able to browse to, and then add the vcproj file. This had previously had problems. The analysis also ran successfully. The GSITK project is rather trivial, so I moved on to the main LaBat Eylau project. This too ran successfully, though it took to run on my laptop: a 1.5 Ghz single core machine with 512 Mb memory running XP SP2.
The results were worth the wait, though. The Visual CppDepend IDE displays the analyzed data in a number of compelling ways.
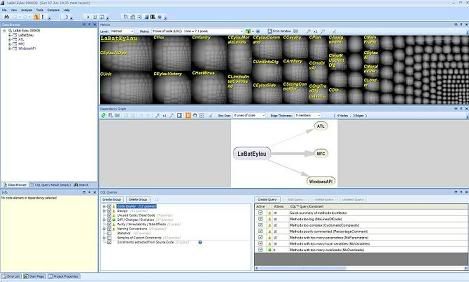
This first picture shows several of the views that help to organize the analyzed data. The Class Browser (upper left) shows a standard treeview that allows you to drill down into your project and other assemblies referenced by your project. Clicking on classes and namespaces in the treeview updates the Info window (lower left). The Info window shows counts of the number of methods and fields within the selected node that are used by the project. Expansion of the node for a namespace reveals exactly those methods and fields.
Right click on a method, and you can run a CQL query to find out where that method is called. You can also view the results of the CQL query in the Dependency Matrix and the Metrics view.
The level of integration between the views is excellent. Clicking on some data in one view updates all the others. You can export CQL query results to Excel, XML, HTML, or text.
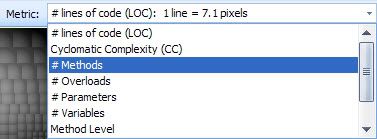
I noticed that the Metrics view had some filtering controls, so I started playing with them. I was pleasantly pleased to find I could change the metric the view was based on easily. To find complex code, I selected the Cyclomatic Complexity. SLOC, #methods, #fields, and other metrics are available.
Note the Select Top X control. This allows you to select the top methods based on the selected metric. Select the # of lines of code, then select top 10 to highlight the 10 largest methods in your project.
The end result of this is that you can rapidly cycle through different kinds of code smells in your project, finding the worst culprits to be the focus of your maintenance efforts.
I'm happy to report that my laptop is back up on the home network. Here are the notes from my first eval on the 6th and 7th, along with some pictures I blocked out on the 16th.
I downloaded and installed the CppDepend beta on June 6th. I had to install WinRAR eval to do so, as the Beta is distributed as a RAR file. I extracted the files the to C:\Program Files\CppDepend directory I had created for the Alpha test; I backed up and cleaned out the Alpha files first. Visual CppDepend worked the first time I tried it, using the icon I had already set up on my desktop for the Alpha test.
I tried to analyze the GSITK project first. It worked! I was able to browse to, and then add the vcproj file. This had previously had problems. The analysis also ran successfully. The GSITK project is rather trivial, so I moved on to the main LaBat Eylau project. This too ran successfully, though it took to run on my laptop: a 1.5 Ghz single core machine with 512 Mb memory running XP SP2.
The results were worth the wait, though. The Visual CppDepend IDE displays the analyzed data in a number of compelling ways.

This first picture shows several of the views that help to organize the analyzed data. The Class Browser (upper left) shows a standard treeview that allows you to drill down into your project and other assemblies referenced by your project. Clicking on classes and namespaces in the treeview updates the Info window (lower left). The Info window shows counts of the number of methods and fields within the selected node that are used by the project. Expansion of the node for a namespace reveals exactly those methods and fields.
Right click on a method, and you can run a CQL query to find out where that method is called. You can also view the results of the CQL query in the Dependency Matrix and the Metrics view.
 |  |  |  |

I noticed that the Metrics view had some filtering controls, so I started playing with them. I was pleasantly pleased to find I could change the metric the view was based on easily. To find complex code, I selected the Cyclomatic Complexity. SLOC, #methods, #fields, and other metrics are available.
 | |  |
The end result of this is that you can rapidly cycle through different kinds of code smells in your project, finding the worst culprits to be the focus of your maintenance efforts.
posted by Bill at 9:35 PM
![]()
 RSS Feed

0 Comments:
Post a Comment
<< Home